Figures of reconstruction
These examples shows various methods of making reconstruction figures.
bad <- 1
good <- 3
wave <- 3
xlim <- c(22, 88)
ylim <- c(32, 68)
L <- c(15, 15)
file <- system.file("extdata/data", "ab16.txt", package = "BioSSA")
df <- read.emb.data(file)
bss <- BioSSA(cad ~ AP + DV, data = df, ylim = ylim, xlim = xlim, L = L)
bss <- BioSSA(cad ~ AP + DV, data = df,
L = L,
step = 0.5,
xlim = xlim, ylim = ylim)
rec.elem <- reconstruct(bss, groups = 1:6)
# Sections for testing the reconstruction quality
rec <- reconstruct(bss, groups = list(good = 1:good, bad = 1:bad))
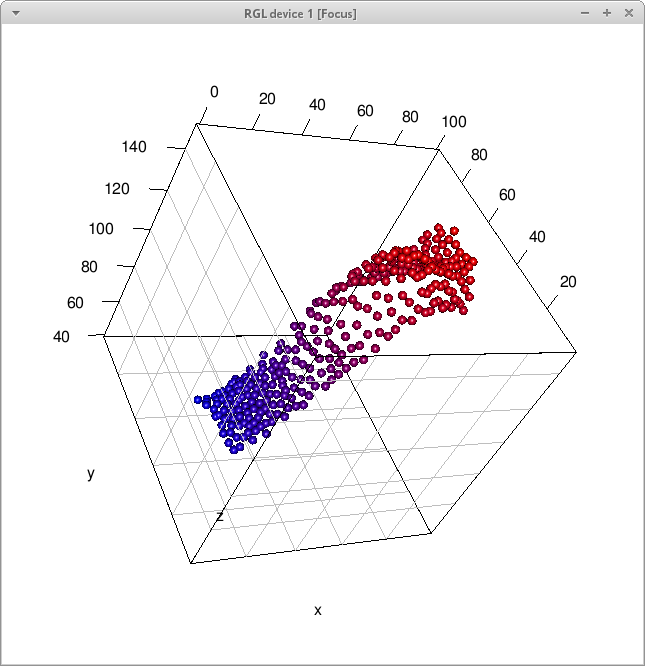
# 3d-figure of reconstruction
plot(rec$good, type = "nuclei-3d", col = c("blue", "red"))
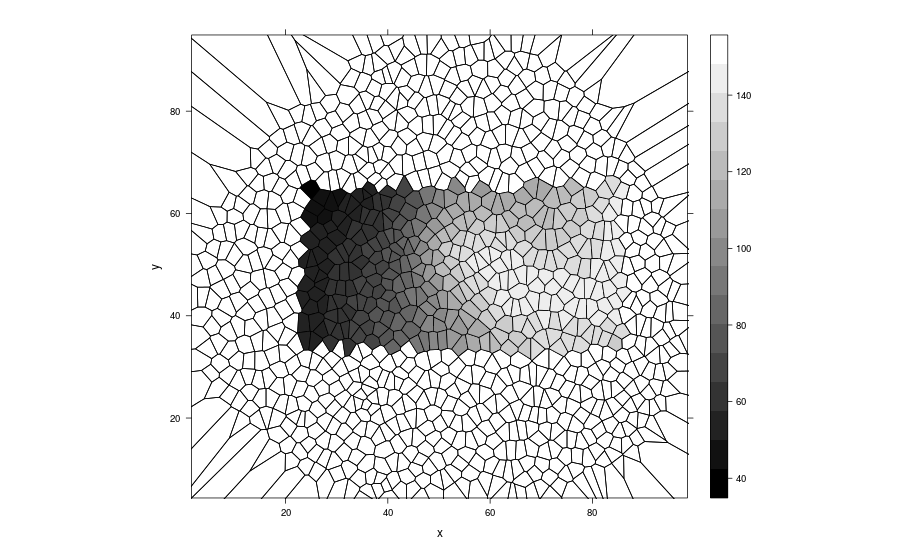
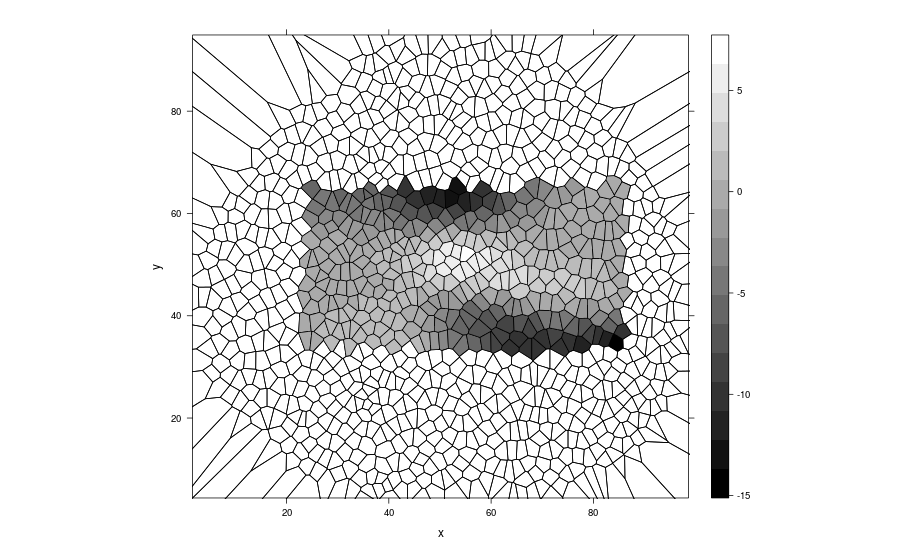
# 2d-figures with triangulation
plot(plot(rec$good, type = "nuclei-2d"))
plot(plot(rec.elem[[wave]], type = "nuclei-2d"))Produced output