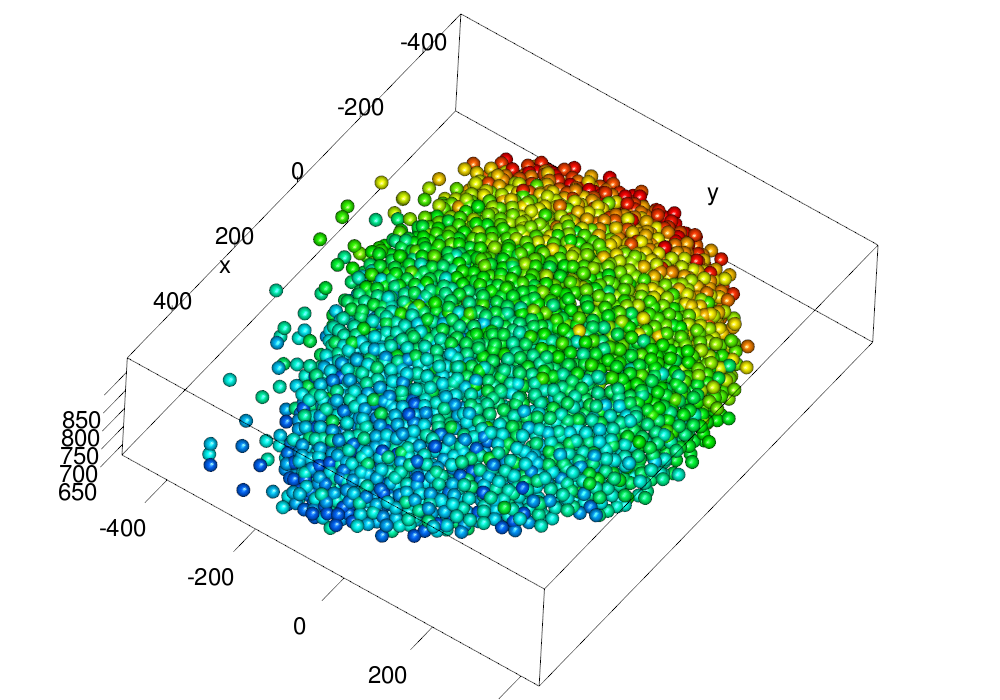
Figures of normalization and reconstruction
These examples shows various methods of making normalization and reconstruction figures.
library(BioSSA)
df <- read.csv(fpath <- system.file("extdata/fly3d/MatchIT", "gsc_ntla_wt_t008_ch01.csv", package="BioSSA"), sep = ";", header = FALSE)
names(df) <- c("cell.global.id", "expression.data", "time.stage", "x", "y", "z", "trash1", "trash2")
df$trash1 <- df$trash2 <- NULL
df$value <- df$expression.data
df$x <- -df$x
df$y <- -df$y
df$z <- -df$z
mask <- TRUE
N <- length(df$value)
signal <- 2*exp((df$x-500) / 200) + 3*exp((500-df$x)/600)
cuts <- 15
sigma <- 2.5
set.seed(1)
df$value[mask] <- signal + rnorm(N, sd = sigma)
ss <- BioSSA3d(value ~ x + y + z, data = df,
cuts = cuts,
kind = "sphere",
alpha.impute = 5000,
circular = FALSE,
L = c(1, 1, 1), rel.window = FALSE)
em <- ss$emb3
dir.create("scheme", showWarnings = FALSE)
col3d <- rev(rainbow(100, start = 1, end = 0.6))
plot.bb(em, "rotated")
plot.bb(em, "equalized")
alpha.quantile <- 0.02
scale.range <- quantile(c(em$values, em$field$f),
probs = c(alpha.quantile/2, 1-alpha.quantile/2),
na.rm = TRUE)
ball.size <- 1
ball.size.sp <- 1.25
ball.size.ssp <- 1.25
lit.sp <- TRUE # Use 'FALSE' to disable light effects
zoom.big <- 0.835
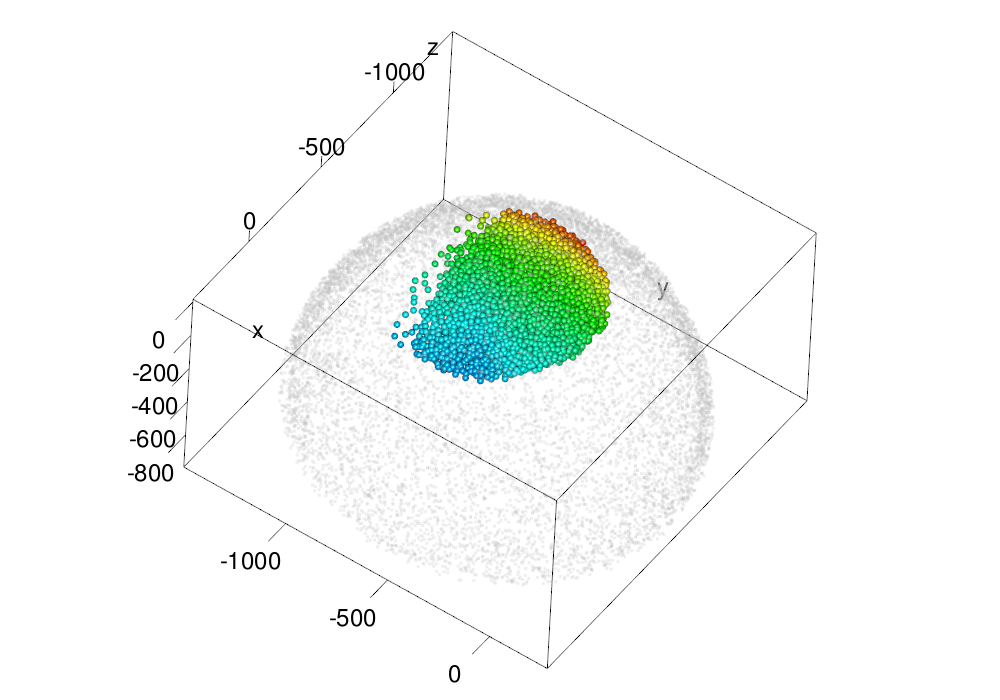
make.gl("scheme/original_ssp.png", plot.em(em, type = "nuclei", size = ball.size.ssp, col = col3d,
scale.range = scale.range, cos.trashold = 0, lit = lit.sp),
lit = lit.sp,
zoom = zoom.big)
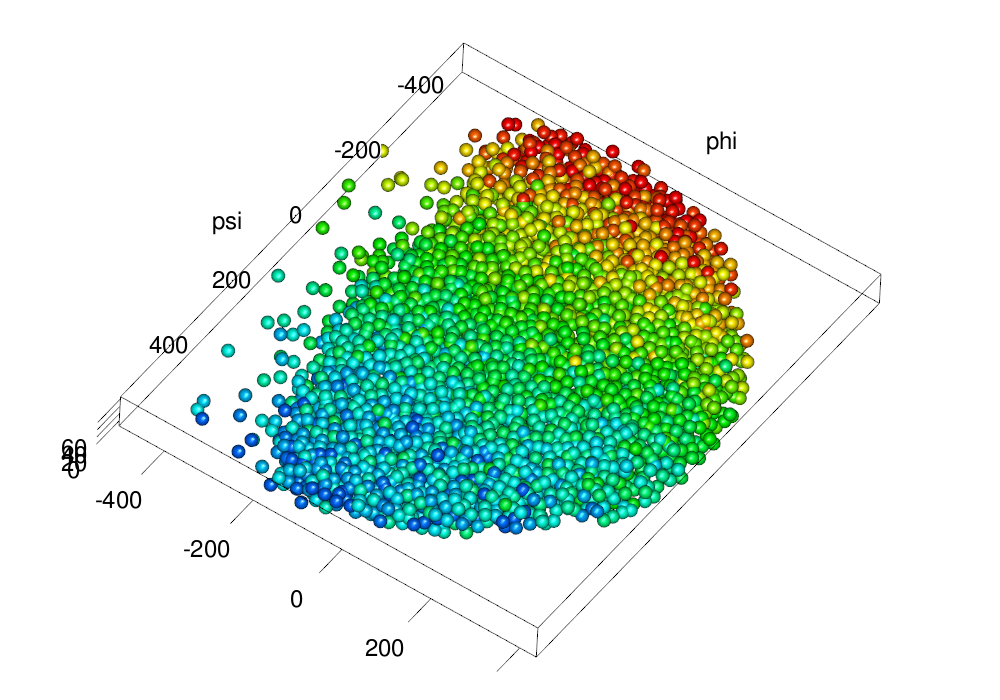
eqv <- attr(attr(em, "unfolded"), "X.eq")
eqv.em <- em
eqv.em$x3d <- eqv[, 1]
eqv.em$y3d <- eqv[, 2]
eqv.em$z3d <- eqv[, 3]
make.gl("scheme/equalized.png", plot(eqv.em, type = "nuclei", size = ball.size, col = col3d,
scale.range = scale.range))
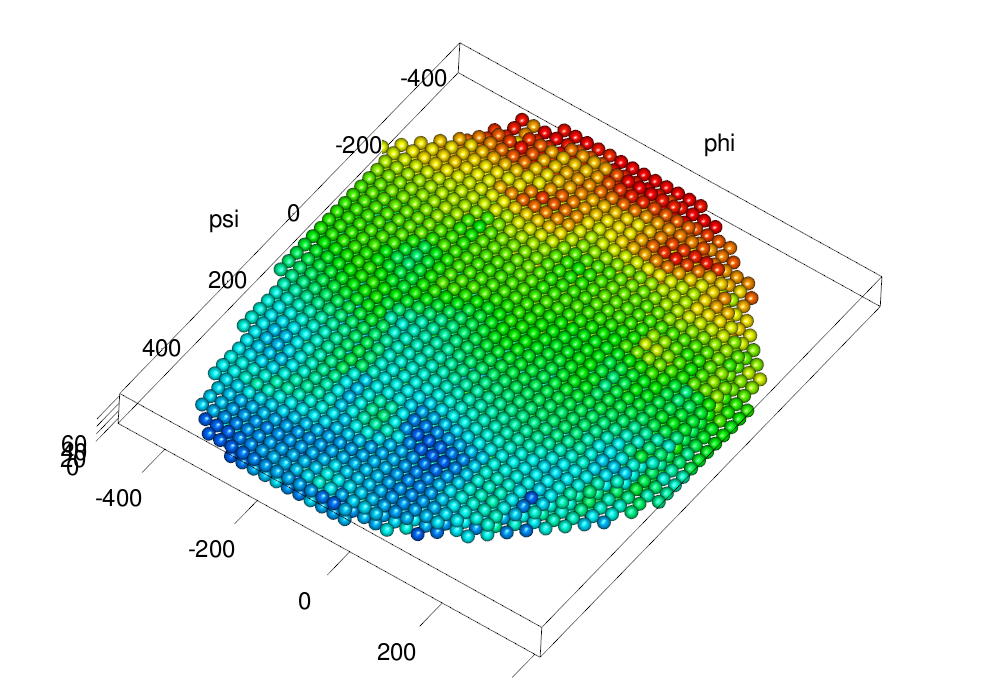
make.gl("scheme/flattened.png", .plot.embryo3d.nuclei.flattened(em, size = ball.size, col = col3d,
scale.range = scale.range))
make.gl("scheme/regular.png", .plot.embryo3d.nuclei.flattened(field2emb(em), size = ball.size, col = col3d,
scale.range = scale.range))
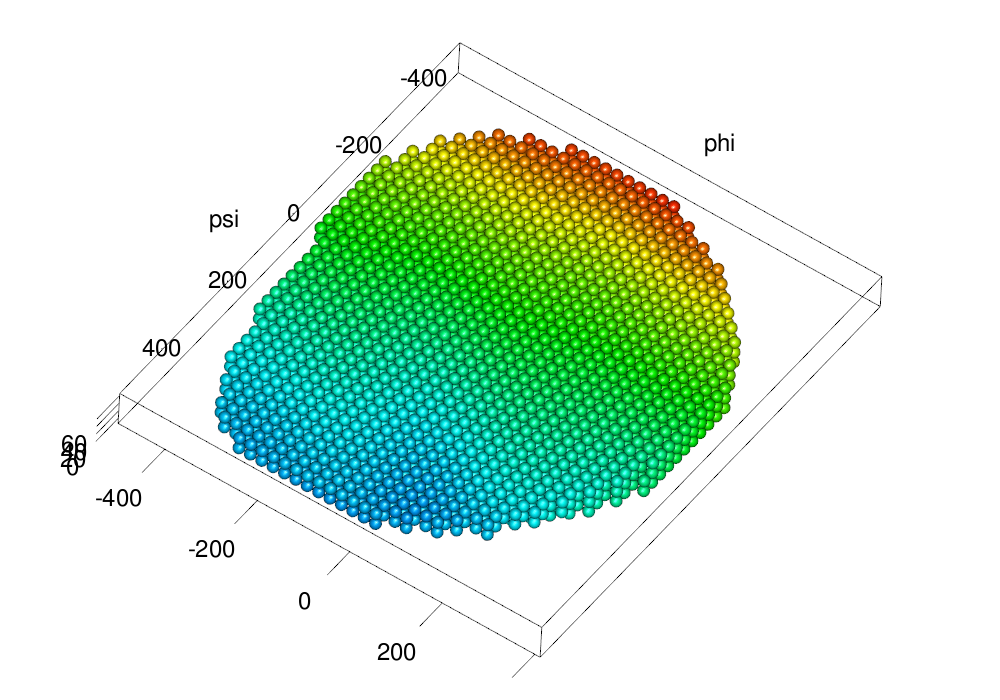
L <- 0.4
ss <- BioSSA3d(em, L = L, rel.window = TRUE, elliptical = TRUE, neig = 10)
rec <- reconstruct(ss, list(1:2))$F1
frec <- field2emb(rec)
.plot.embryo3d.nuclei.flattened(field2emb(em), size = ball.size, col = col3d,
scale.range = scale.range)
bbox <- par3d()$bbox
make.gl("scheme/rec_reg.png", .plot.embryo3d.nuclei.flattened(frec, size = ball.size, col = col3d,
scale.range = scale.range,
xlim = bbox[1:2],
ylim = bbox[3:4],
zlim = bbox[5:6]))
make.gl("scheme/rec_orig_ssp.png", plot.em(rec, type = "nuclei", size = ball.size.ssp, col = col3d,
scale.range = scale.range, cos.trashold = 0, lit = lit.sp),
lit = lit.sp,
zoom = zoom.big)Produced output